Most folks install and stop. Don’t. The dashboard shows LLM cost, developer time saved, and prompt health—with no prompt content stored.
pip install docoreai
export DOCOREAI_KEY=YOUR_API_KEY   # Windows: set DOCOREAI_KEY=...
python -m docoreai start           # starts local agent & telemetry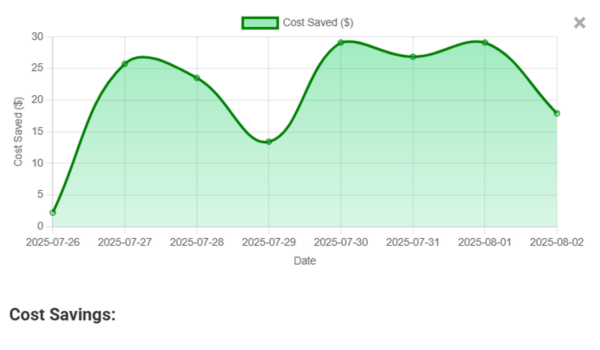
See Cost Savings Over Time
Spot waste, compare models, and track the impact of temperature tuning on your spend.
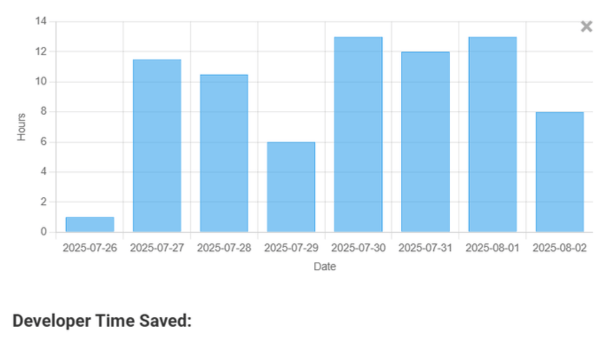
Quantify Developer Time Saved
Fewer retries and faster outputs translate to real hours back per engineer each month.
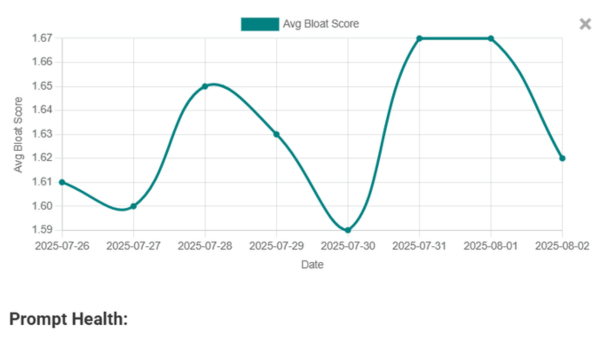
Measure Prompt Health
Track over-generation (bloat) and determinism to cut token waste without hurting quality.
Works with OpenAI & Groq today. More providers coming soon.

One-line CLI run

Insightful Charts: Developer Time Saved, Cost, Time Distribution
Pingback: LLM Cost Analytics Dashboard: Metrics, Layout & ROI | DoCoreAI
Pingback: Analyze GPT Prompt Efficiency: Cut Token Waste Without Losing Quality