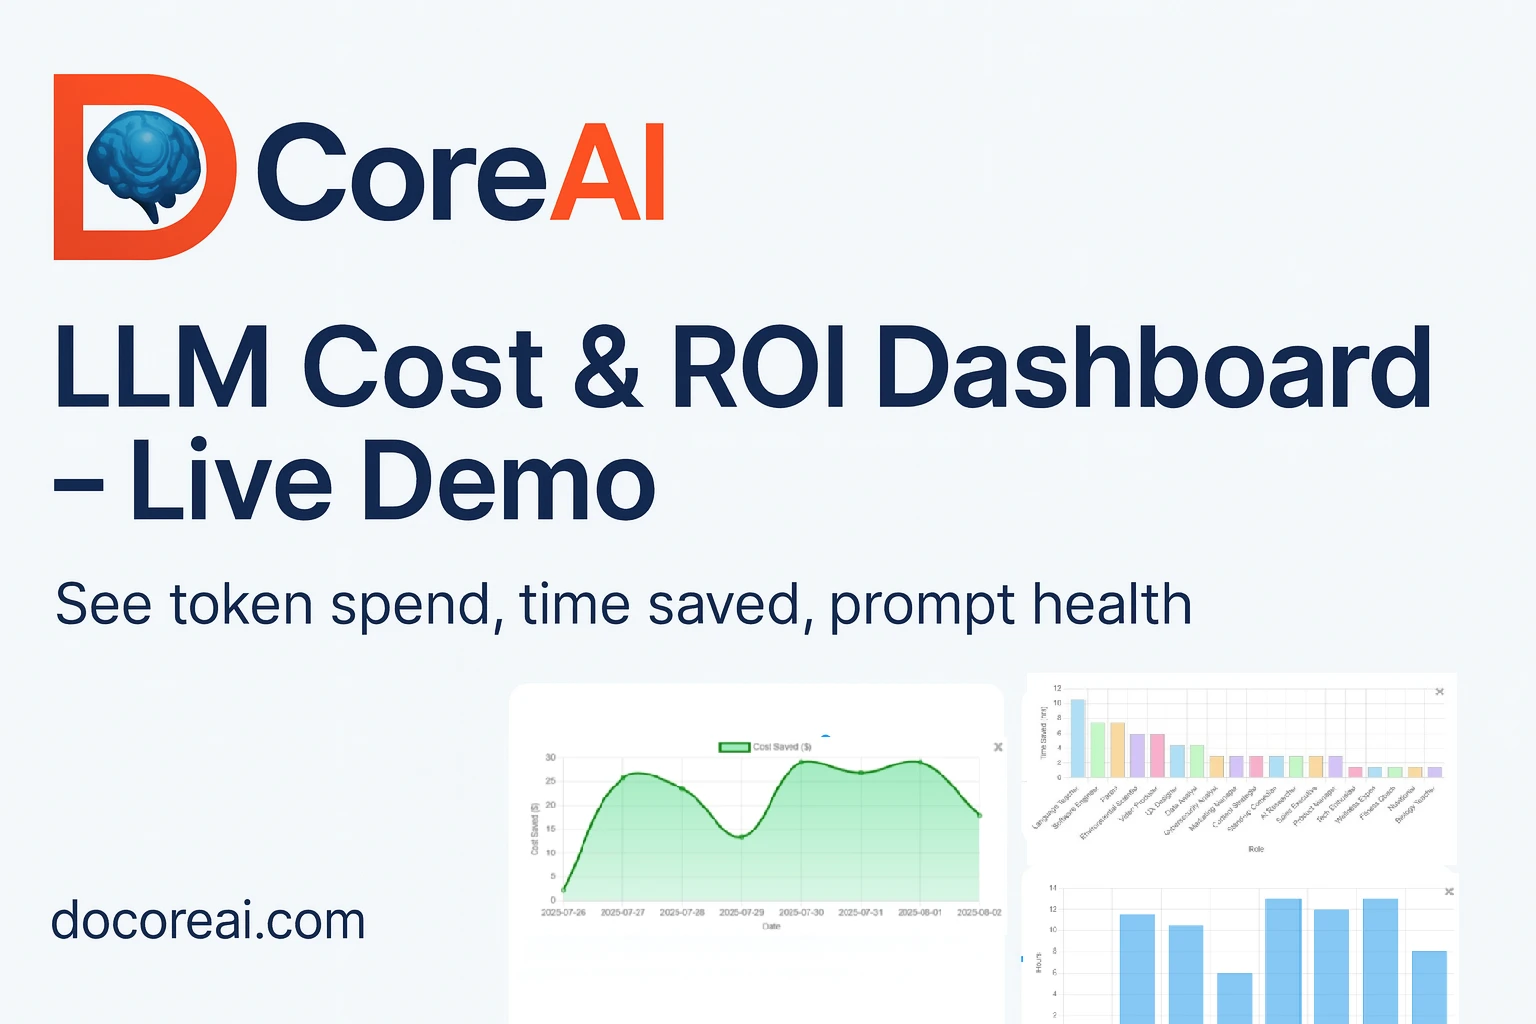
LLM Cost Analytics Dashboard (Demo) — Built for Devs & Tech Managers
See where your LLM budget goes—and how to cut it. This demo shows cost, efficiency, and developer time saved with DoCoreAI’s temperature tuning and prompt health—without sending your prompt content to our servers.
Preview the Management Dashboard
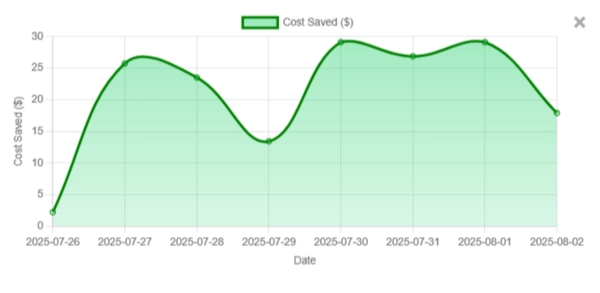
Below are sample charts with a simple Before/After toggle to show impact from temperature tuning and prompt health. Click “View insight” on any card for an executive summary.
What You’ll Learn From the Dashboard
An executive-friendly view of spend, efficiency, and outcome quality across teams. It centralizes telemetry—without storing your prompts—to guide cost cuts and stability improvements.
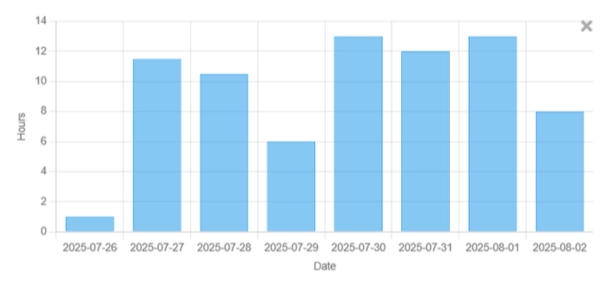
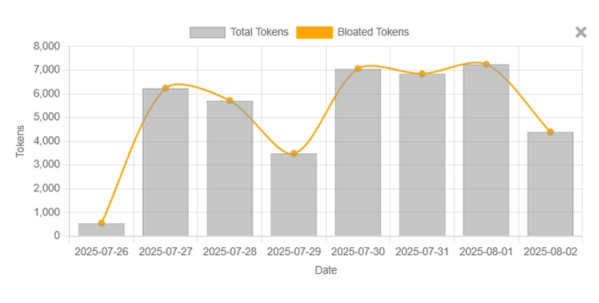
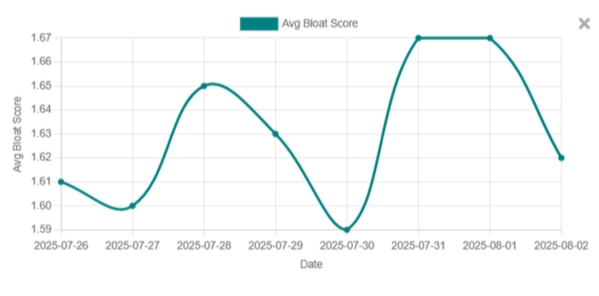
Measure over-generation, retries, and determinism to reduce token waste and engineering time. See how “prompt health” translates to lower costs and faster delivery.
How DoCoreAI Works (No Prompt Content Stored)
Client-side optimization
DoCoreAI’s client inspects each request locally and adjusts temperature and related parameters. Your original prompts and responses stay on your machine.
Server-side analytics
Only telemetry—timings, token counts, success rates—flows to the dashboard. This is enough to compute cost, efficiency, and ROI without seeing your content.
Integrations & Setup (Zero-code Drop-in)
Security & Governance
Your data governance matters. DoCoreAI avoids storing prompt content and provides visibility for finance and engineering leadership.
- No prompt content leaves your environment; only telemetry is collected.
- RBAC-ready dashboards and team scoping.
- Audit-friendly summaries for monthly reviews.
Questions Managers Ask
Does DoCoreAI store our prompts or outputs?
No. The client runs locally and only sends telemetry (counts, durations, success signals) for analytics.
How quickly can we see savings?
Teams typically see early gains within the first week as high-variance prompts are tuned.
Which models are supported?
Works with OpenAI and modern LLM APIs via Groq; your team can choose the models that fit cost and quality needs.
Developer vs. SaaS edition—what’s the difference?
Developer edition demonstrates temperature tuning logic locally; SaaS adds dashboards, team-level telemetry, and leadership reporting.
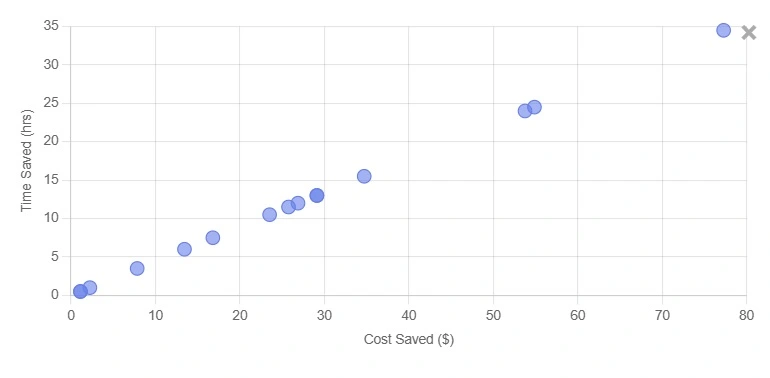
How do you calculate ROI?
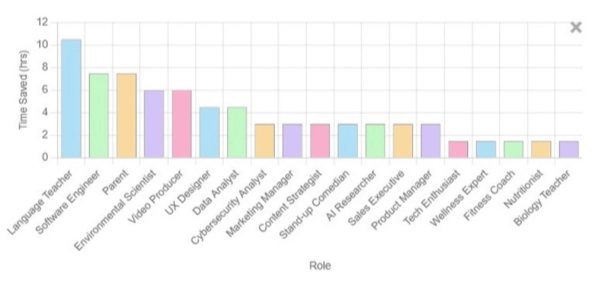
Blends direct cost cuts (token spend) with developer time saved and infra overheads.
Ready to See Your Own Numbers?
Run DoCoreAI for a week and compare Before/After results across teams.
Last updated: August 11, 2025 • This is a public demo. Your full dashboard is private to your workspace. Learn how we protect data.